
Enter your monthly impressions, current CTR, and average order value. See exactly how much revenue a better click-through rate would generate.
Find this in Seller Central → Brand Analytics or Advertising reports.
Find this in Seller Central → Advertising → Search Term Report, or Brand Analytics.
Your typical selling price or bundle price.
Amazon average is roughly 10–15%. Use your actual rate if you have it.
Category average is typically 2–3.5%. Use the benchmark table below as a guide.
Updates as you type. All figures are monthly estimates.
Not sure the images are the problem? Get a free image audit
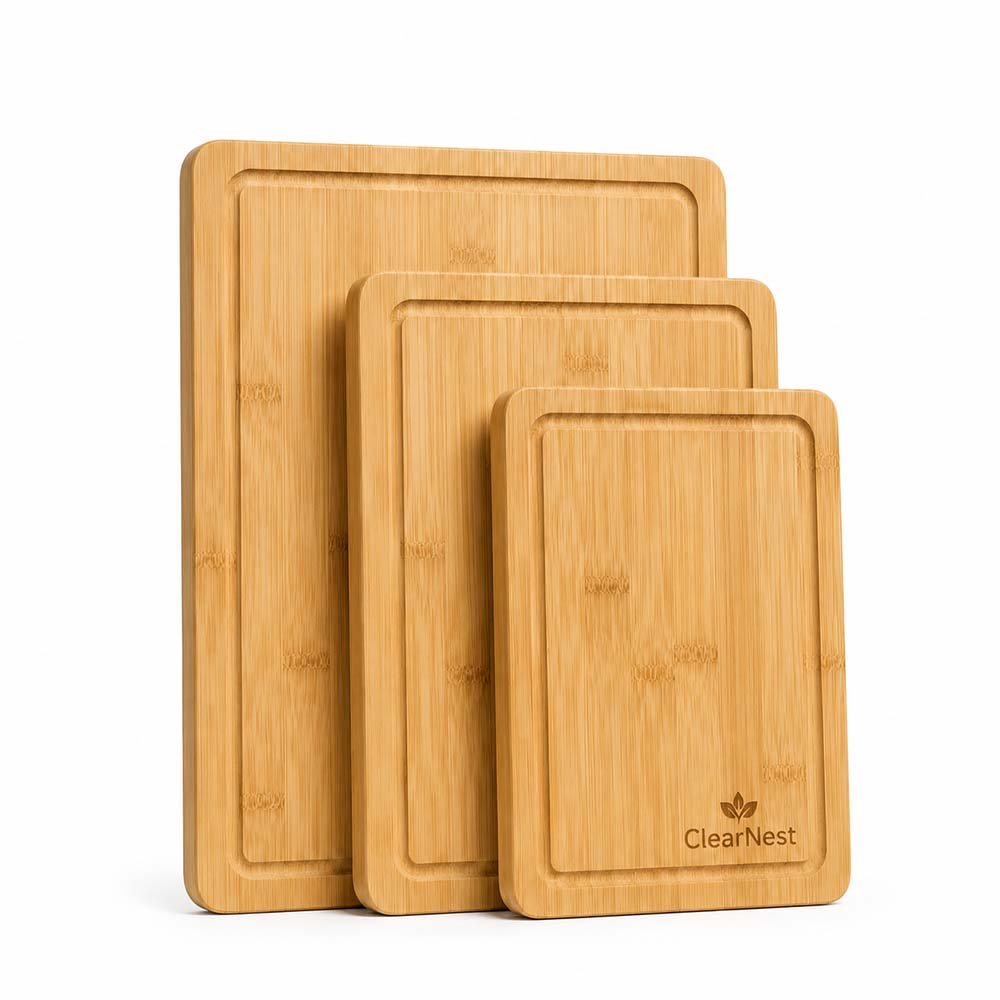
Product gets lost at thumbnail size.
The main image does most of the CTR work — clarity, scale, and first-impression read at search-result size. That is the first thing an image audit checks, and the first thing a rebuild fixes.
See how we review a hero imageCTR (click-through rate) is the percentage of people who see your listing in search results and actually click on it. A higher CTR means more traffic to your listing without spending more on ads.
The formula is straightforward:
The calculator assumes everything else stays constant: your conversion rate, your price, and your ad spend. In practice, more organic clicks also improve your BSR ranking, which can compound the effect.
The benchmarks in the table are directional — actual category averages vary by keyword competitiveness, price point, seasonality, and listing maturity. Use them as a rough target, not a guarantee.
Flat-rate packages rebuild the image set around clarity, proof, and buyer confidence — research-led, designer-reviewed.
Fix My Listing ImagesNot sure the images are the bottleneck? Get a free image audit — no sales call, no obligation.